Plots from this program plot_fft.c
Printed output plot_fft_c.out
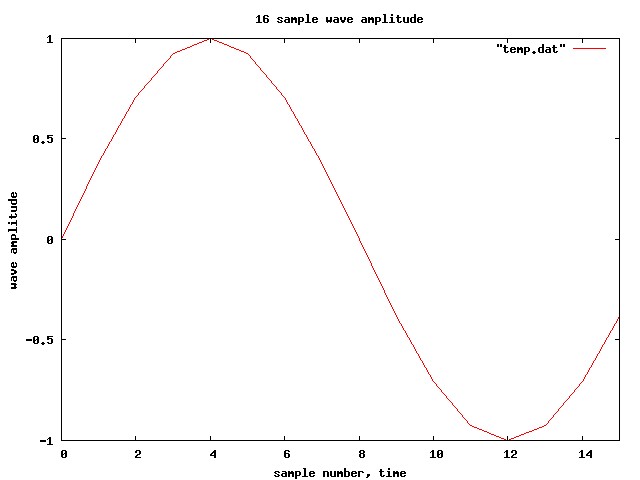 eight sample input of one cycle
amplitude of signal
eight sample input of one cycle
amplitude of signal
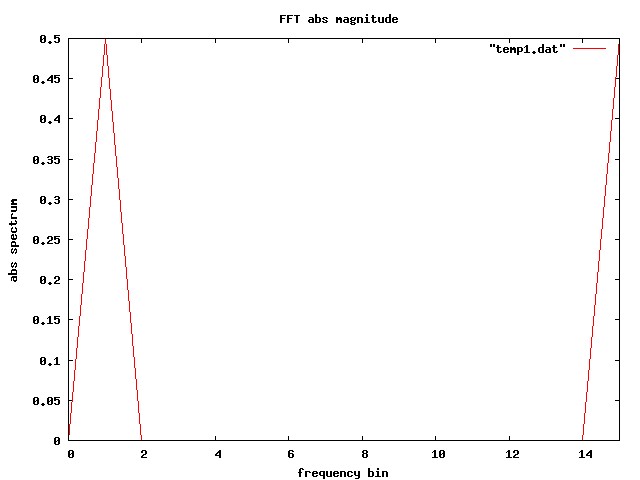 eight point input of one cycle
normalized absolute value of FFT complex output
eight point input of one cycle
normalized absolute value of FFT complex output
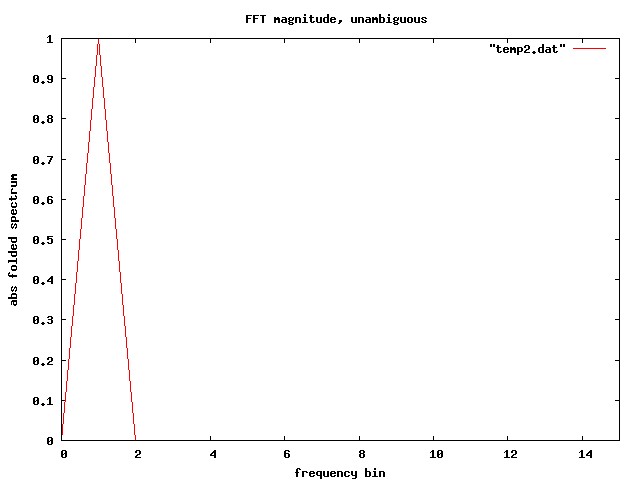 eight point input of one cycle
unambiguous spectrum, half as many values
a=cx[i].real+cx[nfft-i].real cx[2*i] cx[2*(nfft-i)]
b=cx[i].imag-cx[nfft-i].imag cx[2*i+1] cx[2*(nfft-i)+1]
v=sqrt(a*a+b*b)/nfft
eight point input of one cycle
unambiguous spectrum, half as many values
a=cx[i].real+cx[nfft-i].real cx[2*i] cx[2*(nfft-i)]
b=cx[i].imag-cx[nfft-i].imag cx[2*i+1] cx[2*(nfft-i)+1]
v=sqrt(a*a+b*b)/nfft
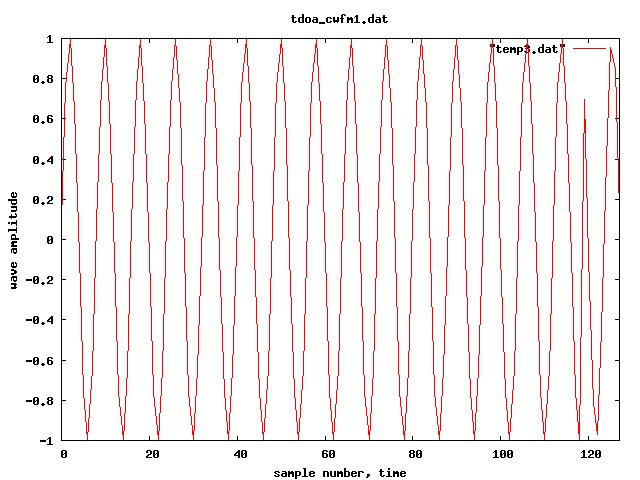 tdoa_cwfm1.dat
amplitude of signal
tdoa_cwfm1.dat
amplitude of signal
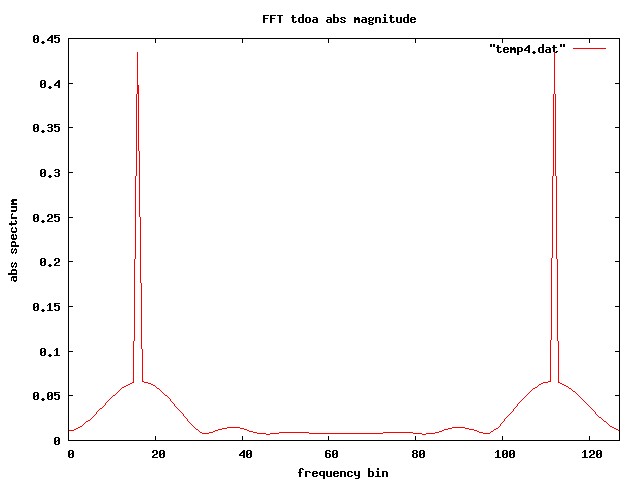 tdoa 128 complex point FFT
absolute value of FFT complex output
tdoa 128 complex point FFT
absolute value of FFT complex output
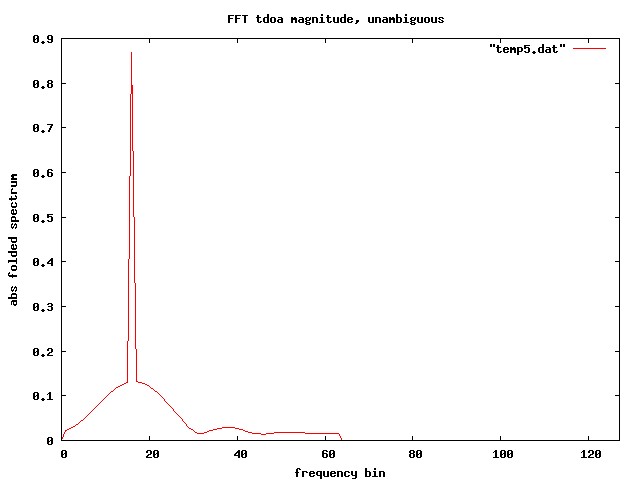 tdoa 128 complex point FFT
unambiguous spectrum, half as many values
a=cx[i].real+cx[nfft-i].real cx[2*i] cx[2*(nfft-i)]
b=cx[i].imag-cx[nfft-i].imag cx[2*i+1] cx[2*(nfft-i)+1]
v=sqrt(a*a+b*b)/nfft
tdoa 128 complex point FFT
unambiguous spectrum, half as many values
a=cx[i].real+cx[nfft-i].real cx[2*i] cx[2*(nfft-i)]
b=cx[i].imag-cx[nfft-i].imag cx[2*i+1] cx[2*(nfft-i)+1]
v=sqrt(a*a+b*b)/nfft