[what is small-volume hypertext?]Small-volume hypertext or microtext is a single document with explicit links among its components. One has to examine carefully, microscopically a document to construct these links. A small-volume hypertext system provides a computer medium for manipulating the links of microtext. The popular usage of the term hypertext refers largely to microtext, and in this document the terms may, when no confusion should result, be used interchangeably. In this document a microtext system manages a single document and is intended to be used in stand-alone fashion by one person.
[from 1960s to 1980s]Authors for centuries have tried to create implicit, non-sequential links in their documents. The efforts to use electronic computers to facilitate the creation and access of linked text is necessarily much more recent. A fascinating hypertext system was developed in the early 1960s but not made widely available in part because of the costliness of associated hardware. In the 1980s the use of computers to deal with text in richly linked ways has become commonplace.
[Augmentation System]The first hypertext system, the Augmentation System, was developed in the 1960s by Douglas Engelbart's group [Enge68]. The facilities for browsing text were particularly sophisticated. The hardware facilities were also impressive for the time. Among other things, the mouse was invented to support this hypertext system.
[concept network]The working information in the Augmentation System was organized into files, with flexible means for users to set up indices and directories, and to hop from file to file by display-selection or by typed-in file-name designations. The system's creators believed that the symbols one works with are supposed to represent a mapping of one's associated concepts, and further that one's concepts exist in a network of relationships as opposed to the essentially linear form of actual printed records. Accordingly, the concept-manipulation aids derivable from real-time computer support were enhanced by structuring conventions that made explicit the various types of network relationships among concepts.
[Hypertext Editing System]In the late 1960s the Hypertext Editing System was developed on a mainframe computer. At the time the normal technology for editing on mainframes was batch cards. The Hypertext Editing System supported branching text and automatically arranged branches into menus. Authors could specify which branches to follow when printing was to occur.
[marketplace]The Hypertext Editing System failed in the marketplace. In 1968 the Hypertext Editing System was demonstrated to staff at two major publishing corporations, whose staff felt, however, that the Hypertext Editing System was too complex. The idea of sitting behind a computer terminal and authoring and editing was more than the managers at that time were willing to believe [Dam88].
[extending the 1960s]The microtext history of the 1970s was marked by the continued development of ideas that were first implemented in the Augmentation System of the 1960s. Major advances corresponded to the availability of more sophisticated hardware, such as rapid, touch-screen terminals. Commercial success remained, however, limited.
[development stimulated by rapid response terminals]One system, called ZOG (for no obvious reason) and developed at Carnegie-Mellon University in 1972, allowed users to interact with programs through a menu-selection interface [Aksc88]. The slow-response terminals were, however, inadequate for comfortable use. The availability of rapid-response, touch-screen terminals in the mid-1970s renewed the interest of the developers, and several versions of the system were developed in the late 1970s.
[FRESS]The File Retrieval and Editing System (FRESS) was implemented in the early 1970s [Dam88]. Outline and cross-reference files could be viewed and edited. Editing of the outline file (or cross-reference file) would cause the document file to change appropriately. Likewise, editing the document file would change the outline file (or cross-reference file). Every edit was saved in such a way that an undo command could be executed at any time to undo the effect of the edit. In applications of FRESS, the users could follow outlines and cross-references easily, but had difficulty amending the outline or cross-references.
[Dynabook]Also in the 1970s the Dynabook was developed to support reading and writing of text. Most of the interface was manipulated by pointing at the screen, rather than by typing. By selecting an icon on the screen, the reader could change the level of detail. Furthermore, the author could connect any section of the text to an icon and specify what actions should take place after the reader had selected that icon. In one Dynabook display the current page was displayed in the context of the links which that page had to other pages. On the left of the page was a filmstrip of all the pages from which one could have come, and on the right was a filmstrip of all the places to which one could go. Selecting any of these miniature icons took one to the page represented by the icon. Despite its many features, the Dynabook was difficult to use.
[hypertext visionary]The term hypertext was actually coined by Ted Nelson in the 1970s. His visionary ideas ranged through such diverse topics as stores into which people stopped to get information and Stretchtext which one could fold or unfold. Nelson published books that were structured as small blocks of text with many links to other blocks of text [Nels87]. Some of the issues which he raised are still topics of research today.
[database, interface, and semantic network]Microtext may be represented as a database of text and links. A microtext system supports via a graphical interface the creating and accessing of the database. The links and text blocks constitute a special kind of semantic network, while the user perception of the system functionality is determined by the interface.
[object-oriented versus relational]A natural representation for hypertext uses nodes, links, and attributes. This representation is particularly well-suited for graphics, since an attribute may be a graphic. The node, link, and attribute model is part of the object-oriented approach to databases. However, most work on databases has been done for numeric information which is conveniently stored in tables with columns of fixed-width. This popular tabular, or relational, database model can be adapted for hypertext.
[components]An object-oriented design for microtext well suits the character of microtext [Camp88] and uses basically three objects, nodes, links, and attributes: A node contains arbitrary data, including text or images. A link defines a relationship between two nodes. Attributes can be attached to nodes or links. An attribute could include the name of the creator of the node or link to which the attribute is connected or could include a complex procedure which is executed under certain conditions.
[basic operations]The basic operations on an object-oriented database include create, destroy, change, and get. These operations all act on the data whether it be an object, a link, or an attribute. The create operation creates new data; the destroy operation removes data; the change operation modifies data; and the get operation retrieves data.
[paragraph as basic unit]What basic unit of the document word, sentence, paragraph, or section is most appropriately displayed to a reader? A reader is unlikely to want to see only one sentence, and the linking of a document would be excessively tedious, if it had to go at the sentence level. But a paragraph intuitively seems to be the right size for presentation in a window and for linking.
[granularity]The granularity of data affects its utility. If only a large file can be changed, then costs of moving and updating the file are substantial. When one knows in advance the size of object which is most likely to be needed for access and change, then one should try to have the system operate with objects of that size.
[extensibility]Since the properties of objects may get augmented as work with a system continues, representations should be extensible. Traditional database management systems solve some of the problems of extensibility and granularity but not at the right level of abstraction. For instance, the operations which one wants to perform on paragraphs may change as a document is elaborated, and the definition of the paragraph object should permit such changes.
[constraint of column width]A relational database stores the network of hypertext in relations or tables. For instance, a network of nodes and links may be represented in a table with two columns, where two nodes are in one row of the table when they are connected by a link. Typically, these columns have a fixed width or, in other words, store a certain limited amount of information. Graphics and text blocks don't naturally fit into the tabular form.
[text relation]Text blocks may be stored in a relational scheme which contains three columns for a Unique Identifier, the Text, and Sequence Numbers. Text may be defined as an 80-character alphanumeric field (see Figure "Text in Relational Database Form"). The text in a given text block may be displayed by sorting all text fields with the same unique identifier by sequence number.

[graphics]Some graphics may be described as alphanumeric sequences [Geha86]. For instance, a picture with two ellipses connected by an arrow might be described as `ellipse1, ellipse2; arrow from ellipse1 to ellipse2'. Such an object-oriented graphic may be treated as a paragraph, and each line describing the graphic becomes a row in the paragraph table with the appropriate sequence number and unique identifier. If the graphic must be described by a bit-image, then storing it directly in a relational database is impractical. Instead, the bit-image is stored in a file, and the relational database includes a pointer to that file.
[network in relational form]The network of microtext may be viewed in the relational form. For instance, if the nodes of the network contain terms but point to paragraphs, then the following two relations might be used: Network ( $term sub 1$, $term sub 2$ ), means that $term sub 1$ is connected to $term sub 2$. Point ( term, Unique Identifier ), means that the text paragraph identified by Unique Identifier is to be associated with the term. Through a combined view of these two relations, a user could follow a network term to the text about that term.
[definition of attributed graph]The links within a document may be represented as the edges of a graph. An attributed graph associates with each node or link of the graph an arbitrary number of attribute/value pairs. For example, an attribute type might be `text block', and the value of the `text-block' attribute might be a paragraph. The logical structure of microtext may be viewed as an attributed graph.
[nodes and text blocks]Two blocks of text connected by a link may be represented as two nodes with an attribute of text block and a link between the nodes. In the presentation of a text block on the screen, the link will be indicated by a high-lighted term or symbol within the text block (see Figure "Nodes and Text Blocks"). Internally the system must know a label for the target but externally it just shows the entire text block rather than its label.

[buttons]In the screen presentation the labels for links are often called buttons. This name originates from the convention of activating the link by guiding the mouse to the label and then pushing on the button on the mouse. The screen presentation, the way the text is actually stored internally, and ways of logically viewing the structure may all be different. In Figure "Buttons" the screen shows a text block with labeled links. Internally the text is a flat file with markup commands (see Exercise "Hypertext Layout"). In one logical view text fragments are the leaves of a tree whose branches are the labeled links. While the screen presentation doesn't give an explicit name to the text block itself, such a name exists and in the figure is label 0.

[easy to use]The interface is critical to the success of a microtext system. The interface should be easy to use, but there are no well-understood methods for creating such interfaces. Particular guidelines have been developed for browsing and writing in a microtext context.
[semantic and syntactic models]Semantic and syntactic models of user interaction and interface design exist. Since semantic knowledge about computer concepts has a logical structure, this knowledge is expected to be relatively stable in memory. When using a computer system, users must maintain a profusion of syntactic knowledge. Syntactic details include the knowledge of which key erases a character (delete, backspace, ctrl-h, right-most mouse button, or ESCAPE), and what command inserts a new line in a text editor. Such syntactic knowledge may be arbitrary, system-dependent, and ill-structured and, unless regularly used, may fade from memory.
[interaction styles]Four of the popular interaction styles involve menu selection, command language, natural language, and direct manipulation: Command language is flexible but requires substantial training. Menu selection shortens learning and structures decision-making but may slow frequent users. Natural language relieves the burden of learning syntax but requires clarification dialog (see Exercise "Natural Language"). Direct manipulation visually represents task concepts and may be easy to learn. While menu selection systems are attractive because they can eliminate training and memorization of complex command sequences, direct manipulation seems to be the best alternative for a wide variety of users [Shne86]. By the use of direct manipulation rather than command language a novice may begin using a system immediately. Direct manipulation eliminates the possibility of errors from incorrectly typed commands.
[diversity of users]Designers should recognize the diversity of interaction styles. Novice users have no syntactic knowledge and little semantic knowledge of computer issues. For them the system should have few options. Expert users demand rapid response and great flexibility. Designing for one class of users is easy; designing for several is much more difficult.
[diversity over time]Research on information display design has repeatedly shown the need to dynamically model the human cognitive processes that occur when the information is being displayed. Factors positively affecting acceptance at one point in the interaction may have negative effects at other points [Norm84]. In a dynamic system, the information available to the user at any one time preserves the context of interest to the user, rather than forcing some static display on all situations [Mitc86].
[speed]User interface experiments of more than a decade past showed that as the response time of the computer improved from 20 seconds to 0.1 second, the user satisfaction increased. At that time, faster response times weren't feasible, but the hypothesis was that yet faster response would be better. However, the somewhat unexpected result now indicates that response time can be too fast. Users generally prefer response times of about 0.1 second; response times of less than this can cause confusion because screen changes may be difficult to perceive [Shne89]. Unfortunately, the common problem is not that the response time is less than 0.1 second, but rather it cannot be made that short. No matter how elegant the system, if the response time is slow, the system will not be acceptable to users.
[definition of browsing]Browsers may have no clear indication of the type of information that they want. Browsing may be defined as `the art of not knowing what you want until you find it.' [Cove88] There are different types of browsing depending on whether the user has many unrestricted options or not. Success in the less restricted type of browsing depends in some ways on serendipity or luck.
[link standards]The layout of a hypertext screen should draw attention to important pieces of subject matter (information content), as well as the links (structure information). A bold word should not both indicate a button at times but at other times simply indicate an important term. Links always take the reader somewhere else, but do so for different reasons. Each link type should have a distinct and standard style [Hard88]. For instance, a button that takes the user to the beginning of the document might consistently be represented with a picture of a house, while a button that takes the reader to the next page, might be represented with an arrow pointing to the right.
[hierarchical view]With electronic media, it is not automatically apparent how much information is available, how it is structured, and where the reader currently is. In a hierarchical view, the reader gets to see a high-level, tree-structured index in one window, and by pointing at an item the user can view the contents of that document in another window. The stability of the text and the simple cognitive model make the hierarchical view attractive [Shne89].
[fisheye view]The concept of the fisheye view is based upon the analogy to a fisheye camera lens, which distorts the image so that the nearest objects are seen in detail and distant objects are compressed (see Figure "Fisheye View"). In the context of a document, a fisheye view shows full details of the immediate location and outlines of other parts of the document (see Exercise "Fisheye View"). Although the fisheye approach solves some problems, it can be disconcerting. As the user moves the focus of attention the screen changes drastically, and the user must reorient. In one approach to the microtext interface two hierarchical views are presented and provide a kind of fisheye view. The reader sees a page of text and next to that page a hierarchy for the top level of the document and the hierarchy around the current page [Niel90].

[travel metaphor]Text menus or semantic graphs may be inadequate metaphors for browsing. To provide the kinesthetic or tangible feel which people appreciate on paper or in person-person interactions one might exploit space and time metaphors. For instance, a guided tour across a town with the help of a map and a tour company suggests the travel metaphor. In an interface that exploits the travel metaphor, guided tours are initiated when the user selects a coach icon labeled with the topic of the tour (see Figure "Travel Metaphor"). The user is then guided round a sequence of frames on the topic until the tour ends, at which point he is returned to the starting point. In experiments contrasting hypertext interfaces with and without travel metaphors, users of bare hypertext thought they saw the most material, but in fact they saw the least [Alli89]. Guided tours allowed more accurate overviews of the available material and resulted in a higher rate of exposure to new rather than repeated information. Furthermore, a range of access tools was used with no apparent cost in terms of user indecision.

[spaghetti versus museum layout]In one experience a massive semantic net was first presented as a graph [Lena90]. The editing/browsing interface soon became too cluttered and tangled (like a bowl of spaghetti) to be useful. To avoid the spaghetti layout, local instead of global placement of nodes was attempted, but that did not help. Accordingly, the interface was improved to include a `spatial museum room' editor that maps frames metaphorically into floorplans of rooms. In a museum layout system a reader may select a point on a map to reveal enlarged detail in the neighborhood of that point (see Exercise "Museum Layout"). For an actual museum this is done by using a diagram of a museum with various subjects in each part, such as art, science, geography and media. The user looks at the map and has to move to the relevant place using commands, such as forward, left and right. The user then sees a picture relating to the topic of interest and can select further information by using a mouse on the picture itself. Subsequently, menus may be displayed.
[relating task, user, and interface]One would like to be able to say that a certain interface style is best for a certain class of users and tasks. Many papers have been written about the user response to various presentations of hypertext on various tasks. As one surveys these papers, the question continually arises of `what can be said in the general case?'. Such surveys have been performed, and the results show most strongly the importance of user types.
[positive effect of youth]In comparing the results of a 30 studies on microtext, one researcher normalized the results of each study. For each study the performance of the control group was set to 1, and the performance of the test group was expressed as a multiple, perhaps fractional, of that. The characteristics which distinguished the test group were also classified. In most cases the multiple was less than 2, but in one case it exceeded 11. This enormous effect was due to the age of the test group. When the test group was young, its members found hypertext very attractive, whereas when the test group was middle-age, its members were disinclined to use microtext. Young people will accept hypertext more readily than will old people.
[user characteristics are most important]The other most significant factor in the survey of microtext studies was the motivation of the user. When the users were highly motivated to perform a certain task, then they contributed much more to the hypertext exercise than did those whose motivation was less. While this result seems intuitively clear, adequate attention has not paid to this factor. Microtext system issues, such as button style or window placement, are often the focus of a research paper, but the biggest differences in the acceptability of a microtext system are the characteristics of the users themselves.
[screens]The variety of display terminals on microcomputers presents a dilemma to the designer of microtext. The type of display chosen constrains the graphics and screen formats. Screen resolution might range from 200x200 pixels to 1200x1000 pixels, and colors may range from monochrome to 16 million shades.
[input modes]There are four ways to enter information into a computer system: typing, direct manipulation, scanning, and voice recognition [Shne89]. The keyboard allows input of about 100 words per minute but is error-prone. Direct manipulation does not accommodate data entry. Relatively inexpensive scanners for personal computers can translate a page of printed text or an illustration into a computer file. A computer can reliably recognize about 1000 spoken phrases from an individual, but the general capability to recognize discourse doesn't exist. For short, text-oriented documents, typing is the most common input method.
[visual formalisms]This book focuses on the links of hypertext from a semantic or abstract perspective. Yet, much of the attractiveness of hypertext is based on its visual appeal. Can one deal with this visual aspect in a semantic or abstract way?
[icons]Icons are visual symbols for entities or actions. Icons can be used to powerfully represent information. For instance, an icon of a gray cloud could be used on a weather map and be linked to a description of the rain forecast. The opportunity to link part of an image to an elaboration of that part is attractive. For instance, a town on a map may be linked to the enlarged map of that town. In a neuroanatomy tutorial this feature may allow the reader to navigate through the different levels of the brain [Hard88].
[types of images]The role of imagery in hypertext is major but unclear. Should text live in a separate box or should text and imagery be togetherfor instance, a description of the world could be found inside the picture of the world (see Figure "Role of Images")? If one can navigate freely among different kinds of images, then how restricted will one feel to see only line drawings? What is a discordant or monotonous image? [Pric88]

[diagrams versus text]A consistent role for images in human communication is sometimes difficult to determine. When asked to place instructions on paper for someone crossing town from one landmark to another, most people write text and don't use diagrams. Yet, when asked, hypothetically, whether they would include a diagram if giving such information, most say yes. Furthermore, when asked how they would like to be given such information, people say they would like a diagram [Wrig89].
[graphics extend memory]Human memory can be viewed as consisting of three types: long-term memory, short-term memory, and external memory [Simo72]. The external memory may come in the form of a computer graphics screen. Psychological research suggests that individual differences in cognitive style significantly affect the way in which a graphics screen can help a problem solver. Subjects who score high on certain psychological tests are called analytics and are good at imposing structure on a problem. Those who get a low score on this psychological test tend to rely more on intuition. In one set of experiments, short-term memory limitations prevented analytics from solving a problem that non-analytics could solve. With a graphics screen to augment their short term memory capacities, the analytics solve the problem more quickly than non-analytics [Prac86].
[hypergraphs and Venn diagrams]Visual formalisms are visual because they may be generated and comprehended by humans, but formal because they may be manipulated and analyzed by computer. Two of the better known visual formalisms are graphs and Venn diagrams. Hypergraphs extend graphs so that links are no longer necessarily binarya link may connect several nodes. Venn diagrams appeal to the principle that closed curves, such as a circle or blob, may partition the plane into inside and outside regions (see Figure "Hypergraph and Venn Diagram"). A set may be represented by the inside of a closed curve. Thus while graphs may be interpreted so as to represent arbitrary links, Venn diagrams are good for representing sets and relations. In numerous computer-related applications both capabilities are needed.

[higraphs]Higraphs combine the characteristics of hypergraphs and Venn diagrams [Hare88]. Every set of interest is represented by a blobthese give the Venn diagram characteristic. A hypergraph characteristic is obtained by allowing links to connect any number of blobs. In this way, the hierarchies which are important in human cognition can be visually captured by nested blobs, while the flexibility of hypergraphs is kept (see Exercise "Visual Formalisms"). Zoom out capabilities suppress low-level details by removing blobs that are contained within other blobs and are useful for capturing abstraction in the hierarchy. A link to a blob within a blob is replaced by a link to a short bar when `zoom out' occurs (see Figure "Higraph"). Psychological experiments suggest that a higraph-like visual formalism is useful, [Gree82] and microtext systems are being developed whose visual presentation is based on the higraph formalism.

[representing the mind]How can the conceptual model of hypertext be related to the computer model? When what people have in their mind is elicited and compared to various computer representations for hypertext, the semantic net representation often proves particularly convenient. As one might expect, different semantic net types are appropriate for different tasks. By looking at paths through a hypertext semantic net, one can come to higher-level abstractions, such as those of plots in a novel.
[intuitive meaning]The abstraction of a document as a network of concepts and relations is a semantic net. In a semantic network, concepts are defined by their relationships to other concepts in the network. For example, the meaning of `hypertext' may be defined by saying that it contains documents, runs on computers, and serves users. The link types in this example are `contains', `runs on', and `serves'. The nodes are `hypertext', `documents', `computers', and `users'. Semantic nets are a model of memory. They lend themselves to graphic display, and their meaning tends to be intuitively clear (see Figure "Semantic Net Example"). The disadvantage of semantic nets is that the meaning or semantics of the net may be difficult to formalize.

[formal meaning]The best understood semantic net link types manifest inheritance properties. For instance, if the network connects the node `student' to the node `person' with the link `is a', then one can infer that the properties of a student can be inherited from those of a person. Inheritance is a type of transitivity. If a student is a person and a person is an animal, then by transitivity, a student is an animal. Transitivity also applies to the `cause' link. For instance, if viruses cause infection and infections cause fever, then viruses cause fever.
[independent versus embedded]The semantic net of microtext may be independent or embedded. In the `independent' case the nodes and links are tagged with concepts represented by terms [Coll87]. Each node of the net points to text blocks, but the links between nodes can be seen without necessarily seeing the text blocks. In the `embedded' case a document chunk is at the end of a link (see Figure "Independent versus Embedded Semantic Net"). In traversing an embedded semantic net microtext, the user has to visit a text block (see Exercise "Independent versus Embedded").

[experimental method]What kinds of links do microtext authors tend to create? By analyzing microtext, one could collect data about the links created. The link types in one microtext experiment are reported here. In a document creation exercise a class of students was divided into four teams and asked to write a four-part hypertext. The students used a tool with which each text block may contain nodes which link to other text blocks. The students spent two months on the writing exercise and repeatedly revised their hypertext.
[outline links]One particularly interesting text block created by the students is duplicated in Figure "Outline Links". The text block depicted a tree of six nodes. This tree had labels on the edges. For instance, the node `Evaluation' is connected by the `has' relation to the node `Advantages'. Activation of a topic in the tree would take the reader to the beginning of the subsection about the topic. The nodes of the tree which the readers directly see actually correspond functionally to links in the hypertext from the text block to another text block.

[link types]The collection of links the students created can be classified into a handful of types: sequence, outline, reference, and embedded. A sequence link shows a linearity between two text blocks x and y it means that text block x is sequentially or linearly followed by text block y. An outline link goes from an outline to the beginning of that part of the section which elaborates on that portion of the outline. The link is itself part of an outline on a single text block which shows the reader the hierarchical structure of developments in the document. The outline is indicated by a tree on the text block in which the hypertext links are the nodes of the tree. The edges of the tree constitute a type of metalink between links in the outline, although these edges don't cause any change on the screen when the reader points the mouse at them. A reference or citation link goes from a point in text block x where an author's work is discussed to the text block y where that author's citation is detailed. An embedded or cross-reference link is in the text of a text block and takes the reader from a concept in the text block to another text block which has information related to that concept. For every link there can be its inverse ($link sup -1$). For instance, an $outline sup -1$ link goes from a text block to the conceptually nearest broader outline link. A tally of the link types in this experiment showed an emphasis on embedded links and $outline sup -1$ links [Rada89a].
[embedded hierarchical links]The embedded link might be expected to be comparable to a non-hierarchical relation which explores a new, but related, topic. A non-hierarchical link would go from a concept in one text block to a text block which was about a different concept, but that was non-hierarchically related, as for instance in going from the concept `infections' to a text block about viruses (where viruses cause infections). An embedded link of the hierarchical type would take the reader to a text block which goes into more detail on the topic from which the link started. One might expect that most of the embedded links would be of the non-hierarchical type, since the outline links depict hierarchical relations. Surprisingly, however, in this study all the embedded links conveyed a hierarchical, rather than a non-hierarchical relation.
[context dependency]Furthermore, the embedded links had two distinct hierarchical flavors. Some buttons pointed to a straightforward elaboration of the concept as it was represented in the button. For instance, the button `windows' on one text block connected to a text block which described what windows are and that description of windows could have fit into many different contexts where windows were of interest. The other type of embedded button pointed to an elaboration of the concept in the button that was heavily biased by the context in which the button occurred. For example, on one text block there was a discussion about semantic nets which contained a button for `graphical representation' (see Figure "Context-sensitive hierarchical button"). The path to this text block came from a text block about a particular hypertext product. The `graphical representation' button linked to a text block which was not about graphics in general, but was very particularly about semantic nets graphically represented in that specific hypertext product. Thus two types of embedded links were used: context-independent hierarchical and context-sensitive hierarchical.

[individual differences of authors]Do authors prefer to use context-sensitive or context-independent embedded buttons? While a little more than half the embedded buttons were of the context-sensitive type, closer inspection showed a surprising distribution of button types by authors. About 90 per cent of the embedded buttons written by one group were of the context-sensitive type, while about 80 per cent of the buttons created by another group were of the context-independent type. This seemed to reflect the different preferences of the groups of authors, rather than a different intrinsic character of the topics which the groups addressed [Rada89a]. In other words, certain authors had a tendency to use context-independent embedded buttons and others to use context-sensitive embedded buttons.
[whole network versus individual link]While the link between two text blocks in a microtext should be understood, the significance of a whole network must also be considered. If the reader doesn't appreciate why multiple paths between two nodes exist, he or she feels lost. What studies are relevant to the understanding of entire networks of text blocks? Plots of stories provide one well-studied abstraction about the whole network within a document [Meeh81]. Fiction writers have for centuries appreciated the importance of allowing the reader to see a meaningful multiplicity of paths in a story.
[exploratory model]Laurence Sterne's 18th century Tristam Shandy shows many alterations in the narrative flow and provides a rich network of plots. [Ster12] However, for author's less skilled than Sterne, a complex network of linear text may be obscure to the reader and places a heavy burden on the reader to form a conceptual model of the network. An abstract example of alternating narrative is the novel with many subplots that might look something like: ABACADBACEBADEACEFAFAB... where `A' is the `main' plot and B-F are subplots. The link may be common characters or settings. This type of implicit network creates an exploratory text. The difficulty with this style of presentation is that the reader may be repeatedly asking himself `what is the author trying to say here?'.
[developmental model]The alternative to the exploratory model is the developmental model. This differs from the exploratory model in how the links are built and traversed. The developmental model adds directional chains of links, or storylines. Essentially, these are links which are related in that from the beginning to the end of the chain a story is told and comes to closure. A storyline gives reader satisfaction at the end as well as motivation to read further along a different vein.
[twists in fiction]When is the network within a story particularly exciting to read? An interesting story should provide a twist to one's normal expectations (see Exercise "Aesop's Fable"). When one reads fiction, one expects to suspend one's critical reality-based functions. Nevertheless, the story must take advantage of some model which is at least partially consistent with some real world. One key to success for a story is to lead the readers along the path of a model and at some point to help them appreciate that a path could be followed which they would never have expected.
[surprise in non-fiction]For non-fiction the lessons which have been learned from the study of fiction apply in many ways. An interesting non-fiction must still tell the reader something newsomething which augments his model of the world. For non-fiction the role of surprise is less than in fiction. The author must lead the readers along the path of a pre-existing model but then help them appreciate that the path goes somewhere new. However, unlike the fiction case, the non-fiction case requires that the new path be consistent with all the constraints of the real world.
[authoring and browsing]Microtext systems can support creating and accessing microtext. Some of the prominent microtext systems attempt to provide a modeless interface, in which authoring and browsing are performed within the same screen, and minimal overhead is incurred in changing between authoring and browsing mode. Other systems are primarily available as browsing tools.
[wide range of writing systems]The number of microtext authoring systems is growing rapidly. Some of these systems sharply constrain the types of links that can be used, while others impose minimal constraints. In one, the windowing options are endless, while in another only one window can be on the screen at a time. KMS, NoteCards, HyperCard, and Intermedia are microtext systems that are particularly well known for their support of writing.
[system philosophies]The microtext authoring systems have different features: KMS encourages the use of hierarchical link types, and the screen presents two windows, as in an open book with two pages viewable. NoteCards allows any number of windows on the screen and any link types. HyperCard allows only one window on the screen at a time but any link types.
[long history]KMS, or Knowledge Management System, is a commercial microtext system which is a successor to the ZOG system developed at Carnegie Mellon University from 1972 to 1985 [Aksc88]. The 1972 version provided a menu-select interface to a few computer programs. A 1983 version was installed in a nuclear-powered aircraft carrier to support interactive management of complex tasks.
[methods]KMS is based on frames where each frame is a unit of text and pointers to other frames [McCr84]. The database consists of linked files each of which corresponds to a frame. While any kind of link can be used, KMS particularly supports hierarchical links. Users interact with the database by navigating from frame to frame, manipulating the contents of frames, and creating new frames. Tools also exist for inheriting characteristics from one frame to another and for importing material from other sources, such as text files, into frames. links
[frames]Each frame may have six different functional parts: frame title, frame name, frame body, tree buttons, command buttons, and annotation buttons (see Figure "KMS Screen"). The frame title describes the frame topic. The frame name is a unique identifier for the frame, as a page number is a unique identifier for a page in a book. The frame body expands on the topic of the frame. Tree buttons link to frames at the next lower level of the hierarchy. Command buttons initiate actions, such as exiting KMS. Annotation buttons begin with an `@' and provide notes or cross-references. A frame may contain text and figures. The workstation screen is normally split into two windows, each of which shows a frame.

[link types]The source for a KMS link is an individual item in a frame. The destination for a link is a whole frame. A frame is considered to be a small enough unit that the whole frame, rather than any part of it, can sensibly serve as the link destination [Aksc88]. In KMS there are two types of links: tree and annotation. Tree links point to lower-level frames in a hierarchy, such as a chapter of a book. Annotations point to peripheral material, such as comments. These two link types distinguish between structural relationships and purely associative relationships. Links may be more than one line of text and allow the author to provide substantial semantic information about the link.
[ease of user interaction]The KMS user interface is based on the direct manipulation paradigm. Users navigate from frame to frame by pointing the mouse cursor at an item linked to another frame and clicking the mouse button. Editing and browsing are done in the same mode. By exploiting contextual constraints, over 90 per cent of the user's interaction requires a single point-and-click. The average time per meaningful operation is less than it would be for pull-down menus.
[no graphical views needed]In addition to specifying within a frame the children of that frame, KMS provides only one other view of the contentsa listing of the entire hierarchy of frame titles. There is no graphical browser. The outline of the database is not presented on the screen as a two-dimensional graph. In early versions of KMS graphical views were available, but studies showed that the graphical views were rarely used [Aksc88].
[electronic notecard]Creating `notes on cards' corresponds to the first stage in document writing. An early microtext technology was developed by Xerox Corporation to support writing notes. The product, called NoteCards, supports editing and browsing on an electronic generalization of the paper notecard [Trig86].
[card types]Every notecard can be displayed in a window and edited. It can contain text or graphics and is connected to other cards by links. In addition to the general notecard, browser cards and filebox cards may be used (see Figure "NoteCards Screen"). A browser card contains a graph where the labels on nodes correspond to titles of notecards and links between nodes represent links between notecards. A browser card can be edited to change the structure or labeling of a network of notecards, or it can be used as a traversal guide. Selecting a title inside the browser card causes the corresponding notecard to appear in a window on the screen. Filebox cards can be used to categorize notecards. The NoteCards system requires that the title of every notecard occur in, at least, one filebox card.

[links]Links are used to connect individual notecards. Each link has a label and connects a source card and a destination card. A link is anchored by an icon at a specific location in its source card but points to its destination card as a whole. Clicking the mouse in the link icon retrieves the destination card.
[distribution of card types]When a history graduate student wrote a term paper for one of his classes with NoteCards, he needed several hundred notecards and fifty filebox cards [Hala88]. The student kept on his screen at all times a browser card, which contained an outline of the notecards. The experience of the student shows the importance of the browser and filebox cards as organizers of information.
[networks of ideas]NoteCards was designed to help people work with networks of ideas. It is first and foremost an authoring system for creating and modifying networks of cards which represent ideas. NoteCards' intended users are authors, researchers, and designers.
[market penetration]One of the most frequently used personal computer products is HyperCard. While Apple Computer Incorporated doesn't advertise HyperCard as a microtext system, it has several features of a microtext system. Since 1987 HyperCard is delivered automatically with every new purchase of a Macintosh personal computer from Apple Corporation. HyperCard takes advantage of the user-friendly interface of the Macintosh and incorporates features of some of the successful authoring software on the Macintosh [Good87]. In 1989 IBM began marketing a software product called LinkWay which is very similar to HyperCard [Darb90].
[cards]HyperCard presents information on cards and several cards may appear on the screen at one time [Kane90]. The What You See Is What You Get authoring tools, MacPaint and MacWrite, have been largely included within the HyperCard armamentarium and allow one to freely mix graphics and text in a card. Each card has a background which describes the kind of information which can appear in each part of the card. Cards are logically organized into stacks, and cards within a stack may by default have the same background.
[links]Icons or buttons may be inserted in a card to link the button to another card. A link between two cards in a stack is created by entering link mode, defining a button in the one card, and then pointing at the other card. Links from a card in one stack to a card in another stack are not easily created. The meaning of a link can be extended beyond `goto that card' by adding a procedure to the description of the link (see "Expertext Procedures").
[standard images]HyperCard allows many people to easily experiment with visually powerful linking tools and to choose preferred methods of expression. For instance, authors commonly specify that in going from one card to another the reader should see a fade-out from the source card and a fade-in to the destination card (see Figure "Fading"). The visual effects of fading to and from cards may constructively give the impression that one is going down a pathway to a final destination, which will have to be exited by the same route. One of the predefined icons in HyperCard is the `question mark' icon. Popular usage of this icon has it point to information to help a confused user. HyperCard usage may suggest standards for the association of images with the meaning of links.

[history and goals]Intermedia was developed in the mid-1980s at Brown University Institute for Research in Information and Scholarship. Intermedia facilitates creation of highly graphical microtext and complex filtering of text links [Yank85]. Intermedia was designed to work on personal computers more flexible than but similar to the MacIntosh. Its development was sponsored by several industrial firms that couldn't agree on a fair way to market it until late 1989. for Research in Information and Scholarship
[links]A document is created with Intermedia in a direct manipulation environment. Cutting and pasting can be done from one application to another. Links may be created between any two blocks. A block is defined as any material which the user selects within a document. One selection provides the source of a link and another selection determines the destination block. A bi-directional link is created which can then be followed in either direction by user choice. Intermedia supports the creation of graphics and animation. Keywords applied to links allow the user to attach one or more attributes to a link. Paths can also be defined as a sequence of links.
[views]The keywords on links can be used to filter searches. Only links with certain attributes will subsequently be viewable. Views can be generated at different levels including the document-document level, document-block, and block-block level. Since views can be generated dynamically, based on filtering criteria, one user can request different views of the same document in one sitting.
[hierarchies in browsing]How should microtext be browsed? Several microtext browsing systems, the Augmentation System, Emacs-INFO, Guide, HyperTies, and Drexel Disk are described in this section. The Augmentation System demonstrates the basic features of a hierarchical browser. Emacs-INFO and Guide also emphasize the role of hierarchical relationships. HyperTies does not favor a constraint towards hierarchies links may go from any node to any other node. The Drexel Disk emphasizes graphics in hierarchical browsing. browser
[pioneering system]The Augmentation System was developed in the 1960s and introduced many features of hypertext. Some of these features are still not generally available on commercial systems. The system emphasized the hierarchical structuring of text and a flexibility of viewing this structure.
[hierarchy]The Augmentation System team adopted for several years the convention of organizing all information into explicit hierarchical structures, with provisions for arbitrary cross-referencing among the elements of a hierarchy. The principal manifestation of this hierarchical structure was the breaking of text into statements, each of which bore a number showing its serial location in the text and its level in an outline of the text. The paper which reports on the Augmentation System was written with the structure. Part of the manifestation of the approach was the use of labeled, indented sentences or paragraphs. For instance, in one paper section 3 was called `The User System', 3a was `Basic Facility', and 3a1 was `As seen by the user, the basic facility has the following characteristics' (see Figure "Paper about Augmentation System") [Enge68]. By convention the first word of a statement was treated as the name of the statement, if it was enclosed in parentheses. References to these names could be embedded anywhere in other statements. This naming and linking when added to the basic hierarchical structure yielded a flexible, general structuring capability. 3. The User System. 3a Basic Facility. 3a1 As seen by the user, the basic facility has the following characteristics. (*Figure 15::, "Paper about Augmentation System") This hierarchical structure was explicit in papers produced by the Augmentation System team.
[selection]In browsing a document, the user could select the start point and the form of view. In work with paper the first operation is straightforward but the second often requires scissors and staples. In the Augmentation System the display start could be specified in several ways: By direct selection of a statement which is on the displaypointing with the mouse accomplishes this. By selecting a marker to text elsewhere. After identifying a statement by one of the above means, the user could request to be taken directly there for his next view. Alternatively, he could request instead that he be taken to some statement bearing a specified structural relationship to the one specifically identified.
[view]The normal view was like a frame cut from a long scroll upon which the hierarchical set of statements was printed in sequential order. Otherwise, three independently variable, view-specification conditions could be applied to the construction of the displayed view: level clipping, line truncation, and content filtering. Level clipping meant that given a specified level, the view generator would display only those statements whose depth was less than or equal to that level. The line truncation parameter meant that the view generator would show only the first T lines of each statement being displayed. Given a specification for desired content, the view generator could be directed to display only those statements that had the desired content. For example, one could ask for all statements that had the word `memory' within five words of the `association'. This is content filtering. The user could also freeze a collection of statements in the upper portion of the screen. The remaining lower portion was treated as a reduced-view scanning frame (see Figure "Augmentation System Screen"). Any screen-select operand for any command could be selected from any portion of the display. (*Figure 16::, "Augmentation System Screen") This split screen view in the Augmentation System allowed the user to keep some information fixed while scrolling through other information. In this example, the user has selected the topic 1.1. from the upper half of the screen.
[user response]What has the user response to the Augmentation System been? The System was a success in the eyes of those who created it: [Enge68] We have found that in both off-line and on-line computer aids, the conception, stipulation, and execution of significant manipulations are made much easier by the structuring conventions. ... We have found it to be fairly universal that after an initial period of negative reaction in reading explicitly structured material, one comes to prefer it to material printed in the normal form. On the other hand, users who had not helped build the Augmentation System proved less willing to learn the novel features of the interface. The technology on which the System depended was ahead of its time, but the average firm could not afford the high cost of an Augmentation System.
[commercial failure]The commercial rights for the Augmentation System were transferred to a large corporation in the 1970s. In the current system, files are hierarchically structured, and graphics and text can be embedded in the same file. The screen may be divided into arbitrary, rectangular windows. Various selection and viewing facilities are supported. The hardware for the system is no longer particularly expensive, but the system is still not widely used and could be considered a commercial failure [Rose90].
[online help system]Emacs is a powerful editing system which may be freely copiedit is freeware. Many people have contributed software to the Emacs system, and the system is heavily used in research facilities that run the UNIX operating system. One of the many interesting components of Emacs is its online help system, called Emacs-INFO [Stal81]. The text for INFO is stored in nodes which also contain links to other nodes. The interface provides a simple set of commands (often issued by typing a single letter) to activate a link and retrieve another node.
[links]In Emacs-INFO a link to text that is an expansion of a particular topic may be presented on a menu, which consists of a list of node names. When a menu item is selected, the INFO program searches for the required node and displays it. At the top of a node, call it node X, are labels that begin with either Prev:, Next:, or Up: (see Figure "Emacs INFO"). Following the colon is the title of another node. `Prev:' points to a node meant to be sequentially previous to the node X. Conversely, `Next:' points to the node sequentially following X. The `Up:' label is followed by the name of the node that contains the menu entry for X. An option exists to jump to any node in the system by giving its node name. Additionally, the user may request via a `previous-in-time' command to see the node last visited. If the user had been at node Y before going to node X, then activating the `previous-in-time' option returns the user to node Y (see Exercise "Meaning of Previous").

[history begins 1982]Guide began as a research project at the University of Kent in Canterbury, England in 1982. In 1984 Office Workstations Limited implemented Guide as a commercial product [Brow87]. The commercial product is available for a wide range of personal computers. In one example of a Guide application an automobile company uses the system to distribute training manuals to dealerships. The research work at the University of Kent continues in parallel with the commercial development.
[folding and unfolding]The developers of Guide have emphasized the hierarchical structure of a document and the possibility of folding and unfolding entries in the hierarchy or outline. In an unfolding event, the user selects a term in an outline and the text associated with that term replaces the term. Later, selection of the text causes folding, and the text is replaced by its associated outline term. The two principal buttons in Guide implement unfolding in different ways: Replacement buttons when selected with the mouse lead to an in-line replacement of the material linked with that button. The intent is that the replacement material will expand on material around the button. Note buttons are an extension of replacement buttons but display the additional material to which the note button points in a separate window of a split screen. Both buttons keep the original material surrounding the button on the screen after the button is activated, and in both cases selection of the new text causes that text to disappear from the screen (to fold into the document). structure
[goto]The developers of Guide have reluctantly found it necessary to use a third type of button, called a reference button. Reference buttons cause a jump to a different point of the document or point to a new document. These buttons have a goto effect unlike that of the replacement and note buttons. These reference buttons may lead readers into corners and leave them disoriented. But the flexibility that reference buttons allow seems indispensable for some purposes.
[example session]Guide maintains a document in scrollable form. As the user moves the mouse over the screen, the shape of the cursor changes to indicate the type of link available at that point. A book called Hypertext: Theory into Practice has been placed into Guide, and a sample of screens from one Chapter in that book are presented here [Bair89]. The first screen illustrates the use of the note button: when over the name `Baird', the cursor is represented by an asterisk, and after depressing the mouse button, the user is shown a small box of text in the upper right of the screen. This small box provides some details about Baird and remains on the screen only so long as the the button on the mouse is depressed. Upon scrolling into the document one next sees more of the outline of the chapter. When the mouse points to one of the bold headings in the outline, the cursor appears as a circle with an `x' in it. By depressing the mouse button, the user get a replacement or an unfolding of the chapter so as to see more detail about the section whose heading was underneath the circled `x'. When the cursor rests over the unfolded text, the cursor's shape changes to that of a box, and selection of the button would fold the text and return the user to the situation before the unfold was initiated. Scrolling downward and sliding the mouse over the screen, the user next sees a cursor shaped like a right-pointing arrow. This indicates a reference or goto button. Activating the reference button over `Table 1' leads to a new window with the full drawing of `Table 1' in it.
[history]The development of HyperTies began in 1983 at the University of Maryland. A commercial version is available from Cognetics Corporation. The first microtext to be published simultaneously in electronic and paper form was prepared in HyperTies. The microtext is called Hypertext Hands On and was published in 1989 [Shne89].
[architecture]The overall model of a HyperTies database is based on the metaphor of the `electronic encyclopedia'. The database consists of a set of short articles, related to one another by links, which are displayed as user-selectable highlighted strings within the body of the article [Kove86]. Each article is divided into three fields: a title, a definition (which briefly describes the article), and the body of the article. When a user selects a HyperTies link, the destination article's title and short description are shown in a separate window. Confirming the selection causes the source article's display to be replaced by the destination article (see Figure "HyperTies Example"). An article about a topic may be one or more screens long. As users traverse articles, HyperTies keeps the path and allows reversal. Users can also select articles from an index.

[arrow-jump keys]Readers may use arrow keys, touch-sensitive screens, or the mouse to move the cursor to highlighted strings. Several experimental studies have been conducted to test certain design alternatives with HyperTies. Arrow-jump keys allow the cursor to jump to the closest highlighted string in the direction pressed. In the study comparing the arrow-jump keys to the mouse, the arrow-jump keys proved to be an average of 15% faster and preferred by almost 900f the subjects [Shne86a]. The conjecture is made that when there are a small number of highlighted strings on the screen, arrow-jump keys can provide a good mechanism for selection.
[general public needs]HyperTies has been implemented in diverse environments, but the experiences in a museum application best illustrate the special needs of the general public. The museum users often had no prior computer experience and had no obligation to use Hyperties. A surprisingly wide variety of ways to touch a screen were observed. Some users rubbed the screen, some touched with three fingers, some swished elegantly with a fingernail [Shne89a]. Since swishing elegantly with a fingernail did not initiate a response from the computer, the computer instructions or interface should be improved for the `fingernail' user.
[history]Drexel University has for years required all entering freshmen to have access to a personal computer. One need created by this policy was that of introducing students to the capabilities of their computers. To this end the University created a consulting service of which the `The Drexel Disk' was a part [Hewe87]. The Drexel Disk was distributed to all Freshmen at Drexel University from 1984 to 1989.
[design goals]One design goal of the Drexel Disk was to create landmarks to orient users. Another goal was to place the burden of communication and organization on the computer rather than on the user. The menu structure was shallow and wide. Multiple paths to each point were provided. Graphics were extensively used to provide information about space and time. No documentation was given to the user, since the system was intended to be self-explanatory. The design of the Drexel Disk followed good principles of human-computer interaction
[examples of Drexel Disk use]The Drexel Disk provides an attractive interface. In one example of someone using the Drexel Disk, the user first chooses the button called `Miscellaneous'. Next he chooses the `Campus' button and is taken to a map of the campus. If instead he had first chosen the `Index' button, then he could have reached the same map by activating the `see Campus Buildings in Miscellaneous' button in the Index. Once in the map, the student sees the university with streets labeled and buildings numbered. If he selects a building, then the name of that building first appears in the lower windo. After the mouse is clicked a second time over that building, futher information about that building appears on the screen.
[high maintenance costs prompt move to HyperCard]The Drexel Disk has been successfully used by students to obtain information about personal computer facilities at Drexel University. However, since the software was developed there and was not widely used elsewhere, Drexel remains responsible for any modifications to the software. Additionally, as with any such directory service, the directory information itself must be regularly updated. For instance, the hours of operation of the Library may change, and the information in the hypertext about the Library would then need also to be changed (see Figure "Details of one Building"). Since maintenance of the Drexel Disk was expensive, the developers decided in 1989 to switch to a standard software system, namely HyperCard. Sophisticated users could then take advantage of the well-documented and popular features of HyperCard to themselves implement updates to the information system and propose that the updates become part of the next release of the directory. The university was also no longer responsible for the development of the system software because Apple Computer Incorporated continues the development work on HyperCard. In the academic year 1989-1990 all Freshmen at Drexel University were given the campus, computer directory in a HyperCard environment [Hewe90].
[documents]There are many documents in the software life cycle including requirements documents, design documents, software, and software documentation. Software is a special type of document because it must be read by both people and machines. The other documents of the software life cycle are written exclusively for people.
[software engineers use computers and need links]People who work with software documents have access to and depend on computers in a way that other authors typically don't. Computer environments to support people in the development of documents in the software life cycle are called software engineering environments. Many interconnections exist among components, but these interconnections are hard to maintain in paper forms. Hypertext makes it practical to connect all the pieces.
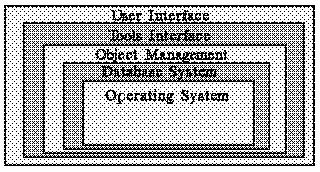
[onion structure]A typical structure for a software engineering environment is built around a layered system like an onion, where there are a number of layers of functionality provided by the different levels in the system. The model includes the following layers (see Figure "Onion Structure"): 1) Operating System 2) Database System 3) Object Management 4) Tools Interface 5) User Interface The Operating System is the innermost layer in the computer system. The outermost layer is the User Interface. (note to publisher: Please use my photo 7, or any of 4 through 8, of my `Sep 21' set).
[operating system]While some software engineering environments use special-purpose operating systems tailored to software life cycle documents, the need for portability has meant that the most systems depend on a standard operating system for the innermost layer. More particularly, the majority of software engineering environments have been built on top of the UNIX operating system. UNIX is both widely available and has many functions that are well suited to managing the needs of software engineers.
[database system]The database layer provides a low-level model for all data. A database management system supports efficient storage and retrieval. Many people can simultaneously access or change the database without accidentally destroying data. The concerns of the database layer are not peculiar to the application of software engineering.
[object management]The object management layer recognizes the entities of the software life cycle. Broadly, the object management layer allows software documents to be named, to exist in a number of different versions, and for relationships to be recorded between documents. Its ability to keep track of the links among document components is one of the most critical functions of the software engineering environment.
[tools interface]The tools interface supports the tools which do specific things, such as retrieve the latest version of a document or create a new link between the software and the software documentation. The most integrated tools intimately exploit the abilities of the object management layer. A tool that is foreign to a particular software engineering environment was not built with that software engineering environment in mind. In order to work, this foreign tool must communicate directly with the operating system and the user interface.
[user interface]The final layer in the software engineering environment is the user interface layer. In an integrated system the tools communicate through the object management layer to the database and then to the operating system. It is equally important that the tools should be integrated at the user interface level, so that users are not faced with the daunting task of learning different tool interfaces. Each tool should have interface conventions which coincide with those of the other tools. For instance, if typing `?' brings help when one is trying to formulate a query to the retrieval tool, then typing `?' should also invoke help when one is trying to create a link with the authoring tool.
[nodes, links, and attributes]An object management system for software engineering environments may be based on nodes which store data and links which connect nodes [Bige88]. Attributes label the types of nodes and links. Furthermore, a link or node can have any number of attribute/value pairs. The attribute `projectComponent' can have any value from the set of project components, namely, requirements, design, code, tests, or documentation. The attribute `relatesTo' is applied to links and can have any value from the set {leadsTo, comments, refersTo, callsProcedure, followsFrom, implements, or isDefinedBy}. By example, a node with a projectComponent value of `requirements' would have a `relatesTo' value of `implements' with the node whose `projectComponent' value was `code'. A node may contain any amount or type of information. A link is not restricted to pointing to an entire node but can point to any place within a node.
[contexts define workspaces]Contexts are defined by grouping nodes and links with certain values. For instance, nodes with the `projectComponent' value of code are implicitly grouped into a context. Contexts allow the partitioning of a project and the definition of workspace. Local workspace allows the software engineer to abstract a subset of nodes and links from the project workspace, make local modifications, test these modifications against the rest of the project, and when satisfied merge the changes back into the global workspace. Ideally, the partitioning of workspaces between engineers should be disjoint, but in practice it may transpire that two or more are working on the same nodes concurrently. In order to allow this, the object management system must resolve concurrent update conflicts and not allow the work of one engineer to be overwritten by that of another when local workspaces are merged back into the project workspace.
[documentation]Traditionally, comments are interspersed throughout the source code of a program. Placing comments within the source code often means that they are too terse to be useful, or if they are more elaborate, they destroy the flow of the program's code. The object management system allows documentation and source code to co-exist in separate linked nodes. The use of a suitable windowing user interface would allow source code and comments to be viewed simultaneously by using comment links. Linear traversal is also possible and source code and documentation may be viewed in sequence by following the appropriate links.
[editing is primary activity]Program and document preparation is the primary activity of software engineers. Text editors enable users to create and modify files, and most environments used for software development offer a number of different editors. Because this is such a common activity, the power of the editor contributes significantly to the productivity of the software engineer.
[language-oriented editors]To support the preparation and editing of programs, some work has been done in developing language-oriented editors, which are designed to prepare and modify programs in a specific programming language [Aref90]. An example of such a system is the Cornell Program Synthesizer which is designed to help beginners prepare programs. Rather than manipulate unstructured text, the system actually manipulates a tree structure representing the program. Such systems may be valuable for beginners wrestling with the idiosyncrasies of programming languages.
[multiple windows]A system with multiple-windows may present different parts of a program and allow interaction in terms of program concepts. For example, one window might show the code for a procedure, with the program declarations in another window. Changing one part of the program results in related parts being immediately identified and presented for modification. Multi-window program preparation systems offer such productivity advantages that they are likely to supplant the use of general purpose text editors for the preparations of programs, specifications, and software designs.
[screen design]A program editing system must present a user interface that intuitively shows the relationships among the parts of the program (see Exercise "Software Engineering"). In one program editor, a box represents a unit of information, and hierarchies of boxes are visually presented [DiSe85]. A box may contain other boxes or text or graphics. A program is a box that contains some boxes with input and output variables and others that specify behavior. Alternative views of boxes are available. Cross-referencing is done through a port which gives a direct view of the destination. The destination box appears as a window on the screen within the origin box.
[translation and evaluation]The world of text remains largely a linear world. If microtext is to be successful, the ability to translate easily between text and microtext is essential. Under what conditions can text be automatically restructured as hypertext? Conversely, how can a microtext be traversed so as to create a coherent linear document? If algorithmic methods don't exist for assessing the quality of text or microtext, how could an algorithm be demonstrated to do a good job of translating between text and microtext?
[paragraphs and links]To map a text into microtext, one must decide how much text to associate with a node or link [Glus89]. If the text is various short messages, then each message may be associated with its own node. For large documents some more clever breakdown is required. Two distinct classes of links are important. Structural links enforce the mapping between the conventional document and the microtext skeleton. These links may be automatically generated from a formatted document. The second class of links give non-sequential and non-hierarchical paths and may be difficult to extract from text. Two classes of text should be distinguished: clearly-structured and implicitly structured. Clearly-structured text has obvious structural links, whereas implicitly structured text doesn't.
[directory]A prime example of clearly structured text is a directory. Technical manuals, dictionaries, encyclopedias, course catalogs, and bibliographies are like directories. The embedded commands in the electronic versions of these texts can be readily translated into a form that a microtext system exploits.
[manuals, dictionaries, and encyclopedias]The documentation for the operating system UNIX has been converted into the microtext format of Guide [Brow88]. Each section heading within the documentation was automatically converted into a Guide replacement-button. The Prototype Electronic Encyclopedia was developed in the early 1980s for browsing encyclopedias. From tapes which contained the typeset for the encyclopedia, the microtext was semi-automatically derived [Weye85]. The Oxford English Dictionary has been placed on the computer to support browsing [Raym88]. Many companies are currently creating hypertext versions of manuals, dictionaries, and encyclopedias.
[translation algorithm]A graph can be used to represent the text to hypertext translation algorithm. The edges of the graph indicate a string which must occur in the text in order that the translator progresses from one node to another. At each node the translator takes some action of moving text into a hypertext form. By example, a bibliography is considered which gives for each document a title, authors, and abstract. This bibliography is prepared with troff commands. Since troff is more a layout language than a logical structure language, some additional logical structure is inferred from expressions in the bibliography, such as `author'. The description of expressions is incorporated into the edges of the `translation' graph (see Figure "Conversion"). (*Figure 20::, "Conversion") This rough sketch of the `translation' graph shows that markers for title, author, and abstract are detected. The text between markers is collected in the small cyclical loops. With the larger cycle the algorithm proceeds from one bibliographic entry to the next.
[requires substantial human effort]Implicitly-structured text refers to text whose explicit logical structure is minimal. The extreme case is an essay which has no subdivisions or other logical decomposition. A novel likewise may often be an extended stream of consciousness for which the logical structure is not suggested in the layout of the document and is not indicated by the markup language which may have been used on the computer. To translate implicitly-structured text into hypertext requires substantial human effort to be invested in characterizing the relations among components of the document.
[example difficulty]The July 1988 issue of Communications of the Association of Computing Machinery had eight papers about hypertext. The papers were independently written for journal publicationin linear form with minimal cross-referencing. Those papers were converted into several microtext products, including HyperTies. The HyperTies effort illustrates the complexity of the task. The eight papers were first divided manually into about 100 HyperTies articles. An overview was added that offered a set of links to topics that were covered in several papers, because the papers didn't provide the links. The conversion process required several person-months of effort. While some portions of the conversion could be automated, it seems likely that conversion of a similar collection of scientific papers would require a similar amount of overall effort [Furu89a].
[secondary authors]In converting text to hypertext, software tools may be applied to restructuring the source text and to polishing the target hypertext. However, intervention may be required at various points. Secondary authors might read documents and annotate them with hypertext links. In one system, part of the hypertext structure was inferred from the source document formatting commands. Then an expert in the domain of the document read the document and interacted with the system in the course of augmenting the network with links which couldn't be inferred from the formatting commands in the document [Pric82].
[example translator]One example of a text to hypertext translator is SuperBook. The SuperBook software analyzes the words and the heading structure of a text. Pieces of the text are presented in a print-like format in one or more arbitrary-sized windows which can be scrolled [Egan89]. The hierarchy in which the text was embedded appears at the top of each window in which text occurs and is changed as the text is scrolled. Appearing in a separate window is a Table of Contents. This Table is automatically constructed by SuperBook based on the formatting commands in the marked-up document.
[linearization]Tools for converting microtext into text could be useful for authors in the intermediate stages of writing. The writer could see how the microtext might be traversed. For readers, the opportunity to get a linear view and perhaps a paper copy might often be invaluable. Yet, how this linearization should be done remains an open question.
[traversal]A traversal of the links of a microtext that visits every text block once and only once has effectively linearized the text. Printing these blocks as they are visited can produce a paper product. How should these traversals be done?
[breadth- or depth-first]Two popular ways to traverse a graph are a breadth-first and a depth-first traversal (see Figure "Breadth and Depth"): A breadth-first traversal starts at a node and visits all the nodes directly connected to it before proceeding in a similar fashion from one of the recently visited nodes. A depth-first traversal starts at a node, visits one of the nodes directly connected to it, and then repeats this process from the last visited node. Both breadth-first and depth-first methods backtrack when a node is reached all of whose directly connected nodes have already been visited (see Exercise "Depth versus Breadth").

[KMS]The microtext system KMS (see previous on KMS) supports printing. Since the text is divided into frames which are embedded in a hierarchy, concatenating the contents of frames from the hierarchy in depth-first order produces a document. Annotations can specify modifications to the layout of the frame. This approach is a hybrid between `What You See Is What You Get' and markup, as directly printing the frame as seen on the screen constitutes `What You See Is What You Get', but the annotations give a markup ability. A new system has been developed as a combination of KMS and a word-processing system and supports large-scale document engineering.
[framework]In one approach to depth-first printing of microtext a text block associated with a link in a semantic net is printed as the link is traversed in a modified depth-first search of the net. The semantic net may be described as a set of frames where each frame has a name of a node and has slots for the links emanating from the node. Each slot in turn has several attributes, called link, target, deadend, order, and paragraphs (see Figure "Two Links"). The value of the link attribute specificies the type of link. The value of the target attribute is the name of the node to which the link points. Deadend `yes' signifies that when the traversal reaches this link, the traversal should not continue to the target but instead should resume from the frame node. Conversely, deadend `no' means that traversal should continue to the target. The value of the order attribute tells the traversal program the priorities among the links in that frame (see Exercise "Depth-first Algorithm"). frame name: `hypertext system' link: `begin' target: `preview' order: 1 deadend `yes' paragraphs `$p sub 1$' link: `past' target: `hypertext history' order: 2 deadend: `no' paragraphs: `$p sub 2$'

[example traversal]If the traversal begins with the node `hypertext system' shown in the Figure "Two Links", then it first crosses the `begin' link and prints the paragraph `$p sub 1$'. Since the `preview' node is a deadend, the algorithm returns to `hypertext system' and looks for the next branch. The process recurs this way as the linear document is created through a modified depth-first search of the semantic network.
[computer program]The traversal program guarantees that every edge in the graph is visited exactly once. The program begins at the edge that the user declares as the starting edge and maintains a variable which holds the current depth of the tree that is being generated. This variable is used to calculate the numeric indices of entries in the outline. (This book was produced using the traversal program).
[constraint-based_traversal]The strict depth-first traversal chooses randomly from the edges emanating from a given node. By ordering the link types an additional constraint may be placed on the traversal (see Exercise "Balanced Trees"). A constraint-based traversal of the graph in Figure "Example Semantic Net for Ordered Link Types" might apply an ordering on link types of caused-by $>$ explained-by $>$ part-of $>$ has-part. If the start node is `hypertext', the depth-first search then follows the link `explain' to the node `new opportunity' and then makes an arbitrary choice between the two links exiting from `new opportunity'. The final traversal touches these nodes, from first to last: hypertext, new opportunity, new technology, history, hypermedia, writer, reader. To print the document associated with the network another algorithm would select the blocks of text associated with the network and place them in sequence according to the sequence determined by the traversal of the network.

[cohesiveness]Given a network to which text is attached, many traversals may exist which produce a linear document. The `best traversal' generates the most coherent document. Cohesiveness is a measure of how well a document can be perceived as a whole, rather than as an amalgamation of disjoint paragraphs. But how is coherence assessed?
[pronoun referent gives cohesive tie]Language is richly composed of many references which set up a commonality of theme between different parts of text or speech. There exist many different types of cohesive tie, but one of the most common is the pronoun. Pronominal substitution is one of the several methods to link sentences and paragraphs and to allow the perception of an overall text. For example: `The golfer hit the ball well. It soared into the air.' Within these two sentences, the situation is easily understood and explained. The it in the second sentence refers back to the ball. The two sentences are bound together by a cohesive tie (see Exercise "Pronoun References").
[automating count of cohesive ties]By studying the number of occurrences of cohesive ties and their locations, one can begin to gain an indication of how well-formed a text is. Assessing the ties manually is time consuming, so if applied to a document comprising more than just a few sentences or paragraphs, automation would be invaluable. It is possible to automatically resolve many of the cohesive ties within a text (at least reducing the amount of work that investigators would have to undergo) and thus provide a method of quantifying coherence of the linearized text [McEn89].
[optimal paths]Cohesiveness can be assessed from a more abstract level than the pronoun reference level. If a semantic net represents an abstraction of the network of text and a traversal of this net produces a linearized text, then this network structure can be directly related to the cohesiveness of the linearization. If the traversal goes from node X to a node directly connected to node X, then the associated text should seem related or cohesive. If the traversal goes from a node X to a node that is several edges distant from node X, then the linear cohesiveness will seem less. The minimum path length between two nodes X and Y is the number of edges that must be crossed in going between X and Y and directly corresponds to the amount of cohesiveness. The cohesiveness of a linearized text may thus be directly proportional to the length of the paths in the semantic net which the traversal algorithm had to follow (see Exercise "Path Costs"). In a network with n nodes, the minimal cost traversal of the entire network must cross paths with a total length of, at least, n-1; these ideal paths are illustrated in Figure "Ideal Paths".

[history lesson]In the early 1960's Douglas Engelbart's group developed the first microtext system, using graphical workstations for the creation and browsing of documents [Enge68]. The mouse was developed to make the information on the screen easier to navigate. At the same time, van Dam's group was developing the Hypertext Editing System. Both systems had technical features which today are still not generally available but which are desirable. When one reads the current literature, one finds discussions of technical possibilities, as though no one had imagined those possibilities. Yet, a careful look at their history should foster understanding of the difference between technical possibility and commercial acceptability.
[user response to Hypertext Editing System in the 1960s]How did users respond to the Hypertext Editing System? A patent document system was implemented within the Hypertext Editing System. While the implementors were able to browse the patent documents easily, other users couldn't. The problem of being lost while navigating among text blocks was significant. To quote one of the creators of the Hypertext Editing System [Dam88]: We already started getting the notion that the richer the hypertext, the greater the navigational problem. But we arranged careful demos in which we knew exactly where we had to go, and people were impressed [with the demonstrations]. Outside the carefully arranged demonstrations, however, the meaningfulness of links among document components was not clear to users.
[different users need different features]The requirements for microtext are difficult to delineate as the evidence is sometimes conflicting. The explanation for this might be that different users with different tasks need significantly different microtext systems. Thus in designing a system one needs to either clearly specify the target users and task or make a system with great flexibility which will readily appear in different situations as a different system.
[representations]A flow-control model, an attributed graph, or a semantic net are formalisms that can support microtext. All represent information with nodes and links and have obvious graphical representations. A general network of terms may provide flexibility but experience suggests that creators and accessors alike need hierarchies to help manage the complexity of microtext. For example, a table of contents may be necessary to complement a lengthy index.
[interface options]The interface should never take the user to a situation from which the user does not appreciate the options. In particular, the system should be tailored so that novice users have few decisions to make. For a window with highlighted buttons or nodes, the user should be able to point to those with a mouse, to use arrow-jump keys to circulate among the options, or to type a description of the desired target. Given that a window corresponds to a node, window placement should be nested for hierarchically connected nodes and tiled for non-hierarchically related nodes. Any traversals by the user should be recorded so that the user can see where he has been. Reversal of path, either by the order of what the user has last seen (dynamic reversal) or by the author's structuring of the graph (static reversal), should be possible.
[authoring guidelines]The authoring challenge is to design the structure of the hypertext to match the ways that a user might want to think about the topics. Text must be structured to support the mental models that readers may create when they use the hypertext system. Each node or edge of the document should be a small self-contained entity [Shne89]. Names of nodes and edges should be consistent.
[modeless]A microtext system should be modeless. Modeless microtext software supports editing or browsing from the same window. One can select certain browsing options, or one can immediately change the contents of the screen. Commands are directly effective rather than simply switching the user from one mode to another.
[discipline]A robust microtext authoring tool should make it easy for the author to specify links and nodes, switch between author and reader mode, import and export text. The system should give the author the option of using many different types of links but should encourage a discipline in link use. The meaning of hierarchical and non-hierarchical links should be clear. Similarly, the system should allow any number of windows to be created but there should be a discipline underlying their choice and placement.
[text to microtext uses markup]The conversion of text to microtext should be supported by the computer. Providing the text has been prepared in a standard markup language, programs can automatically translate the text into, at least, a partial hypertext. The user can then access the text through hierarchical views. Moving clearly-structured text to microtext is straightforward, but less explicitly structured text, such as a novel, is very difficult to translate into microtext.
[traverse network for microtext to text]Given that authors prepare microtext but that paper remains the most attractive medium for many purposes, a good microtext system should support the translation of microtext to text printed on paper. To convert microtext into text, a non-linear structure has to be reduced to a linear structure. The straightforward way for a program to do this is for it to traverse the network and print the associated text as it goes, though, how to guide this traversal so that the resulting text is coherent is an unsolved problem.
[marketplace based on work flow]The history of microtext shows that systems can be built with multiple-functions, but not necessarily succeed in the marketplace. An economic analysis of this failure indicates not only that the system cost should be low, but also that the system must fit into the work flow of the users in a way that makes the computer decidely more attractive than paper or other options.
[repeatable experiments]People don't necessarily agree on what is needed for microtext. One person thinks WYSIWYG is bad, another thinks it is needed [Enge84]. One thinks that bi-directional links are crucial, another that such links are bad. This indicates that methods of evaluating microtext are not well established. The literature reports, often anecdotally, how a system helped or hindered performance on a task. Unfortunately, these experiments are often islands onto themselves, and their results are often impossible to compare. Tasks and measures of success should be standardized so that an experiment done by one group can be readily repeated by another group.
[hypertext layout]Exercise "Hypertext Layout": The Standard General Markup Language and the Office Document Architecture focus on sequential and page-based layout. What additional features would be desirable to create a Hypertext Markup Language or an Office Hypertext Architecture? (40 minutes). General Markup Language
[independent versus embedded]Exercise "Independent versus Embedded": Discuss translations between the independent semantic net microtext and the embedded semantic net microtext. Consider the relation between the terms in the semantic net and the terms in the text itself. Is it always possible to translate from one form to the other? (60 minutes) Aesop's fable
Exercise "Aesop's Fable": From a model of Aesop's fable, one can generate a story. The model of Aesop's fable is that `X has some goal which requires that Y be kindly disposed towards X, so X says something nice to Y, Y reacts accordingly, X achieves his goal but also causes Y to suffer'. The difficulty with the tales based on Aesop's fable is that they become dull after a time. First draw a semantic net which represents an Aesop-like fable and then change it to show a twist to Aesop's fable. (30 minutes).
[natural language]Exercise "Natural Language": What is the advantage to a natural language interface? (20 minutes). fisheye view
Exercise "Fisheye View": A fisheye view may select information according to a `degree-of-interest' function. The degree-of-interest may depend on the link types which emanate from the point of focus. Construct a small semantic net for a microtext and demonstrate different fisheye views based on different degree-of-interest functions. (30 minutes).
[museum layout]Exercise "Museum Layout": The depiction of a semantic net as a graph on the screen may give the impression of a tangled mass of spaghetti. The museum layout approach attempts to structure information so that users quickly appreciate the logical structure of the hypertext. Illustrate an interaction with a `museum layout' interface. (20 minutes).
[visual formalisms]Exercise "Visual Formalisms": While the network in a microtext may be encoded in a database system that makes no direct reference to spatial relationships, the visual representation of the network forces some spatial ordering on the network. For example, even though the network logically represented as `infectious diseases are diseases and diseases cause suffering' does not say anything about spatial relationships, a visual representation of the network would have to show one node above or to the side of another node. Illustrate alternative ways to layout a hierarchy. (25 minutes).
[meaning of previous]Exercise "Meaning of Previous": A link with the name `Previous' could mean several things. Describe the different semantics which Previous might have in microtext. (30 minutes). software engineering
Exercise "Software Engineering": Imagine that software code is nested. Say that parentheses are used to delimit functions or subroutines. Here two functions are nested within another: ( ..... ( .... ) ( .... ) .....). One might want to read about the outside function without reading about either internal function. Develop an algorithm which allows one to select the left parenthesis of an innermost pair of parentheses and have everything from that parenthesis to its matching right parenthesis removed, leaving just the two parentheses. If one selects the second-left parenthesis in the above example, one would get ( ..... () ( .... ) .....). Next, extend the algorithm so that one can point to a left parenthesis of a () pair and have the material which was inside the parentheses appear. This is the inverse of the previous operation. The algorithm might associate a file with the contents of each inner-most pair of parentheses and then fetch the appropriate file. If the user selected the second-left parenthesis from ( ..... () ( .... ) .....), the algorithm would produce ( ..... ( .... ) ( .... ) .....). Discuss how this algorithm compares to an algorithm that would handle the fold and unfold operation of Guide. (2 hours).
[depth versus breadth]Exercise "Depth versus Breadth": To traverse a hypertext network, standard graph traversal methods may be used. Given a hypertext network, contrast the effect of a breadth-first traversal and a depth-first traversal. (20 minutes). depth-first algorithm
Exercise "Depth-first Algorithm": Given a graph with edges that have two attributes: one attribute is `deadend' and one is `paragraphs', sketch an algorithm to do a modified depth-first traversal of a graph. Edges are to be visited only when they have a deadend value of `no'. Paragraphs are to be printed as their associated edges are traversed. (45 minutes) balanced trees
Exercise "Balanced Trees": A spanning tree of a graph is a tree which is extracted directly from the graph and visits every node of the graph. The height of a node in a tree is the number of edges from the node to the most distant descendant of the node. In a balanced tree the height of siblings is the same or different by only one. It may be that a balanced tree cannot be produced from a certain graph. Describe an algorithm that produces an approximation to a balanced tree. Discuss how this algorithm might be applied to linearizing hypertext. (2 hours).
[pronoun references]Exercise "Pronoun References": Pronoun substitution links sentences and paragraphs to allow the perception of an overall text. Text also needs to activate mental models of the reader that help the text seem connected. For the example Popeye hit Bluto on the nose. He soared into the air. explain the cohesive ties which are present. (20 minutes).
[path costs]Exercise "Path Costs": Assume that the cost of the traversal of a graph is equal to the number of edges which must be traversed. For the sample graph (see Figure "Sample Graph") determine the cost of all traversals which start at node A and visit every node of the graph. Are breadth-first or depth-first traversals more costly? (25 minutes).
